Dashboard & Core Metrics
The project overview (/[workspaceSlug]/projects/[projectId]) is where you monitor visitor volume, engagement, acquisition channels, and device distribution at a glance.
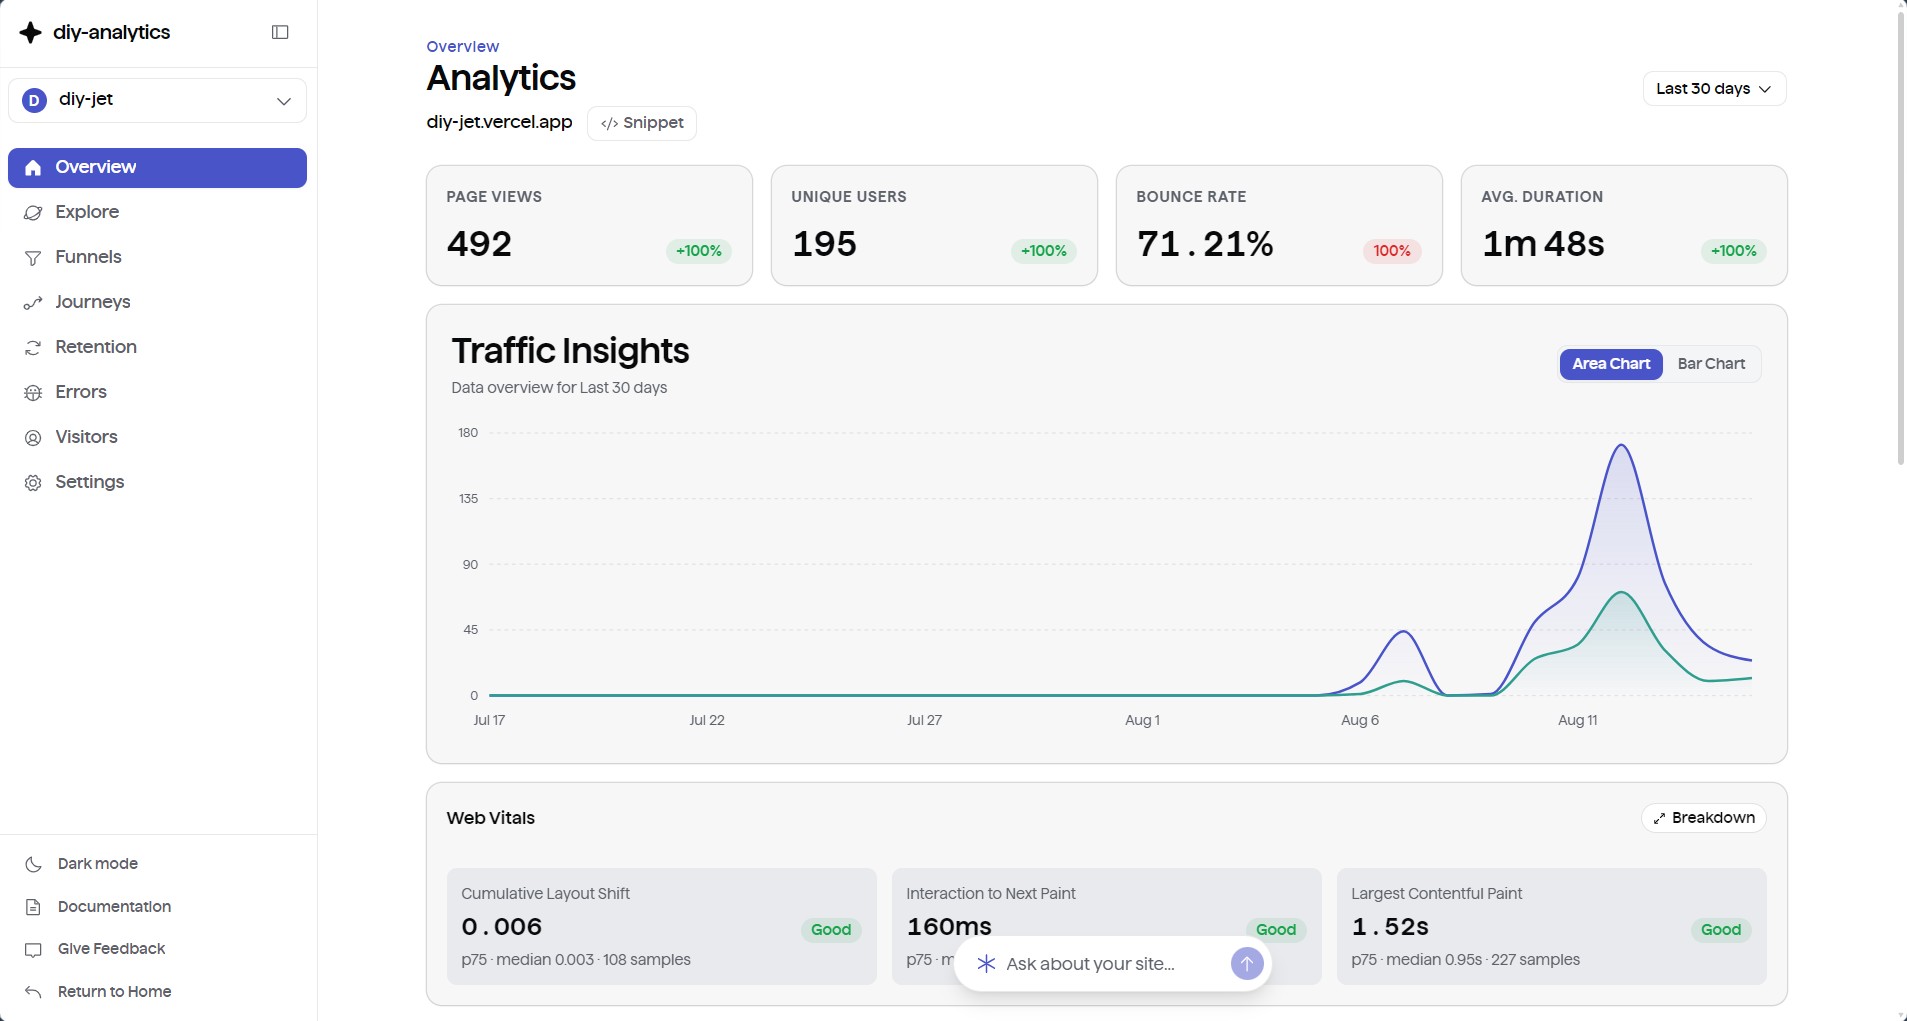
Key Metrics
Every dashboard surfaces five core metrics, each paired with a percentage change against the prior equivalent timeframe:
- Page Views — total pages viewed across all visitors.
- Unique Users — distinct visitors, identified via anonymous, persistent client hashes.
- Sessions — continuous browsing interactions.
- Bounce Rate — percentage of single-page sessions with no subsequent navigation or events.
- Avg. Session Duration — total active engagement time across multi-page visits.
Identity & Session Rules
diy-analytics skips long-lived, intrusive cookies while keeping session continuity accurate:
- Anonymous Identifier — generated locally on the client. No PII or IP addresses are stored.
- 20-Minute Activity Window — a session stays active as long as the visitor interacts with the tab. Clicks, keypresses, scrolls, and visibility changes reset the timer.
- Session Rotation — 20 minutes of inactivity ends the session; the next interaction starts a new one.
Time-Series Chart
The top chart plots pageviews, unique users, and sessions over time.
- Automatic Granularity — bucketing adjusts by minute, hour, day, week, or month based on the selected date range.
- Granularity Toggle — switch manually between daily and hourly aggregation to inspect recent traffic spikes.
Date Ranges & Timezones
Range Presets
- Quick Presets — Last Hour, Last 24 Hours, Last 7 Days, Last 30 Days, Last 6 Months, Last 12 Months, and All Time (up to 60 months).
- Custom Date Range — pick start and end dates from the calendar picker.
- Reporting Timezone — set per project in Settings → General. All team members see the same time buckets regardless of their local browser timezone.
Click-to-Filter
Click any row in a breakdown card to filter the entire dashboard by that dimension.
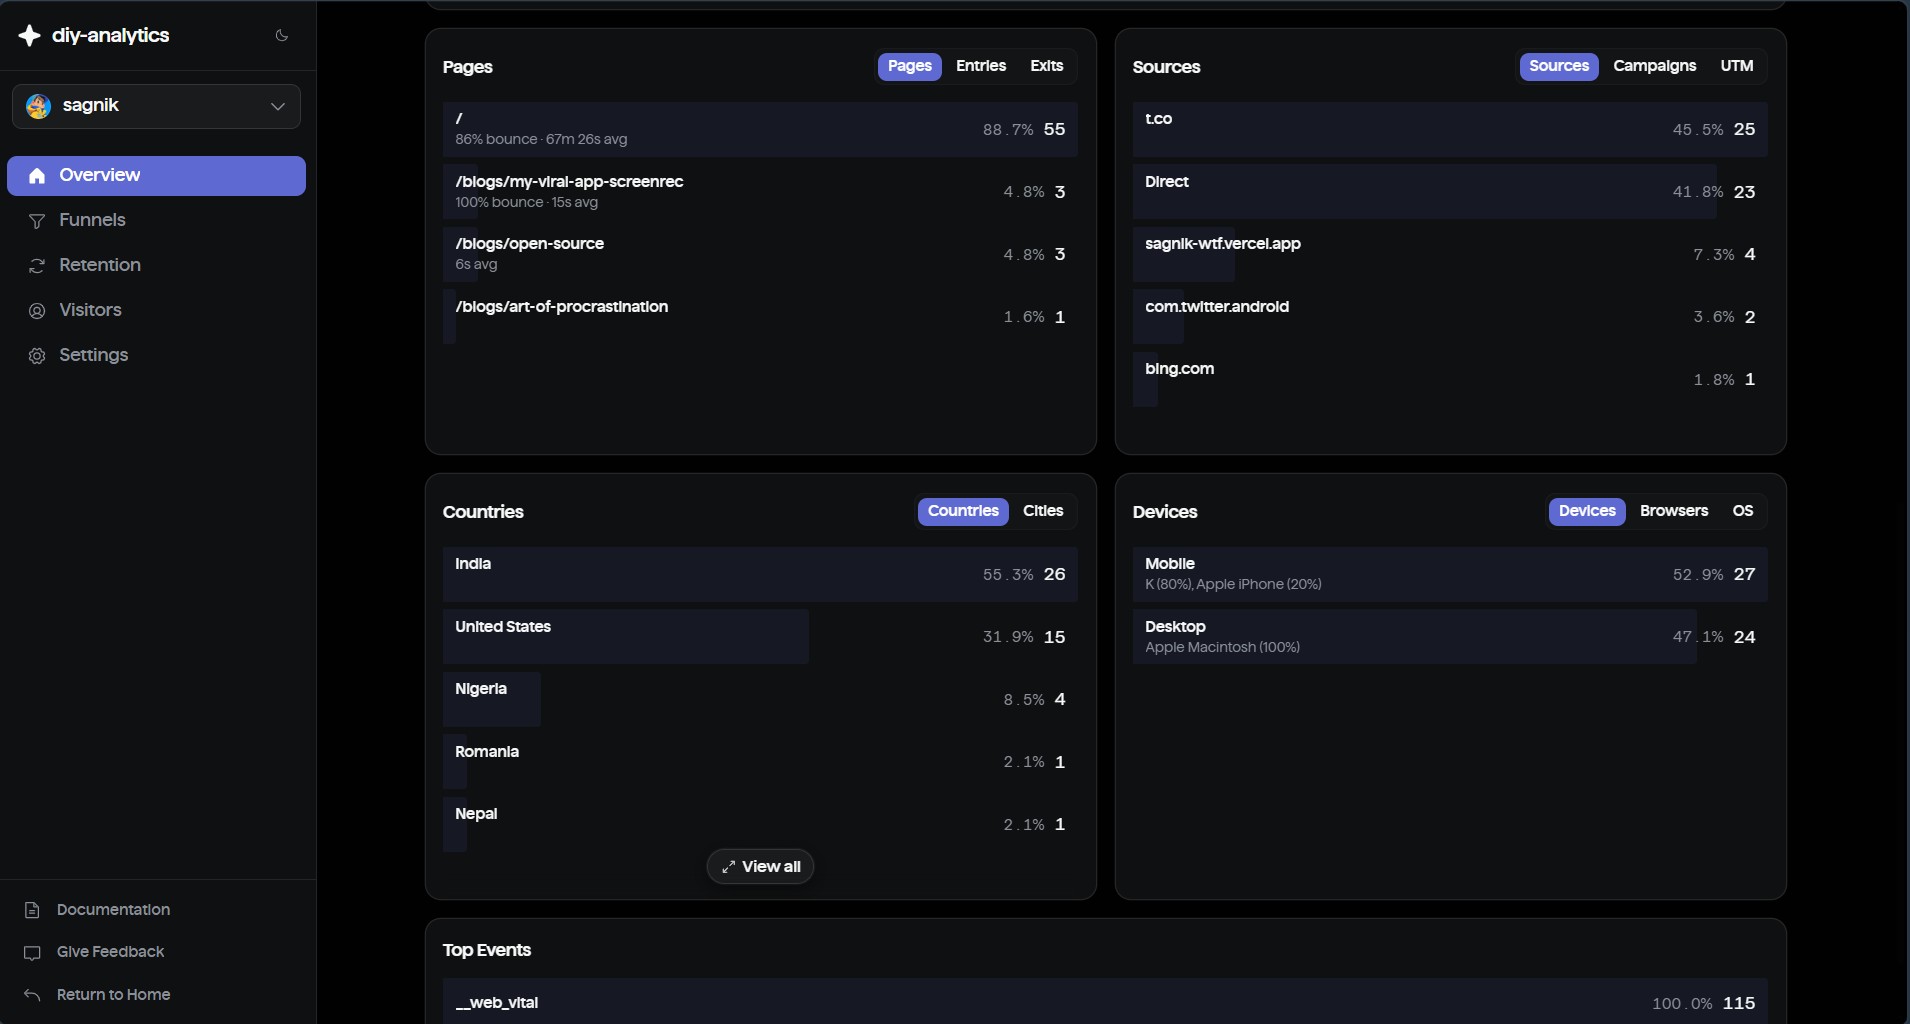
- Multi-Dimension Filters — combine filters, e.g.
Country = United StatesANDBrowser = ChromeANDPath = /pricing. - Active Filter Chips — active filters appear at the top of the dashboard and can be dismissed individually.
Breakdown Cards
| Dimension | Description |
|---|---|
| Top Pages | Most-viewed paths, with per-page bounce rates and average time on page. |
| Entry & Exit Pages | Primary landing pages and the final pages visitors view before leaving. |
| Sources & Referrers | Referring domains, with Direct for bookmarks and untagged links. |
| UTM Campaigns | Grouped by utm_campaign, utm_source, and utm_medium. |
| Geography | Country and city breakdowns, geolocated at ingest time with zero IP retention. |
| Devices & Browsers | Screen categories (Desktop, Mobile, Tablet), operating systems, and browser versions. |
| Top Custom Events | High-frequency custom actions with click-through property drill-downs. |
Real-Time Visitors
A live counter at the top of the dashboard shows distinct sessions active in the last 5 minutes, polling every 10 seconds — useful for watching traffic during launches, campaigns, or social spikes.
The live counter is a good sanity check right after you ship a tracking change: if the number doesn't move, something's wrong with the snippet.