Funnels, Journeys & Retention
Understand how visitors move through your product, where conversion drops off, and how well you retain users over time.
1. User Journeys (Sankey Flow)
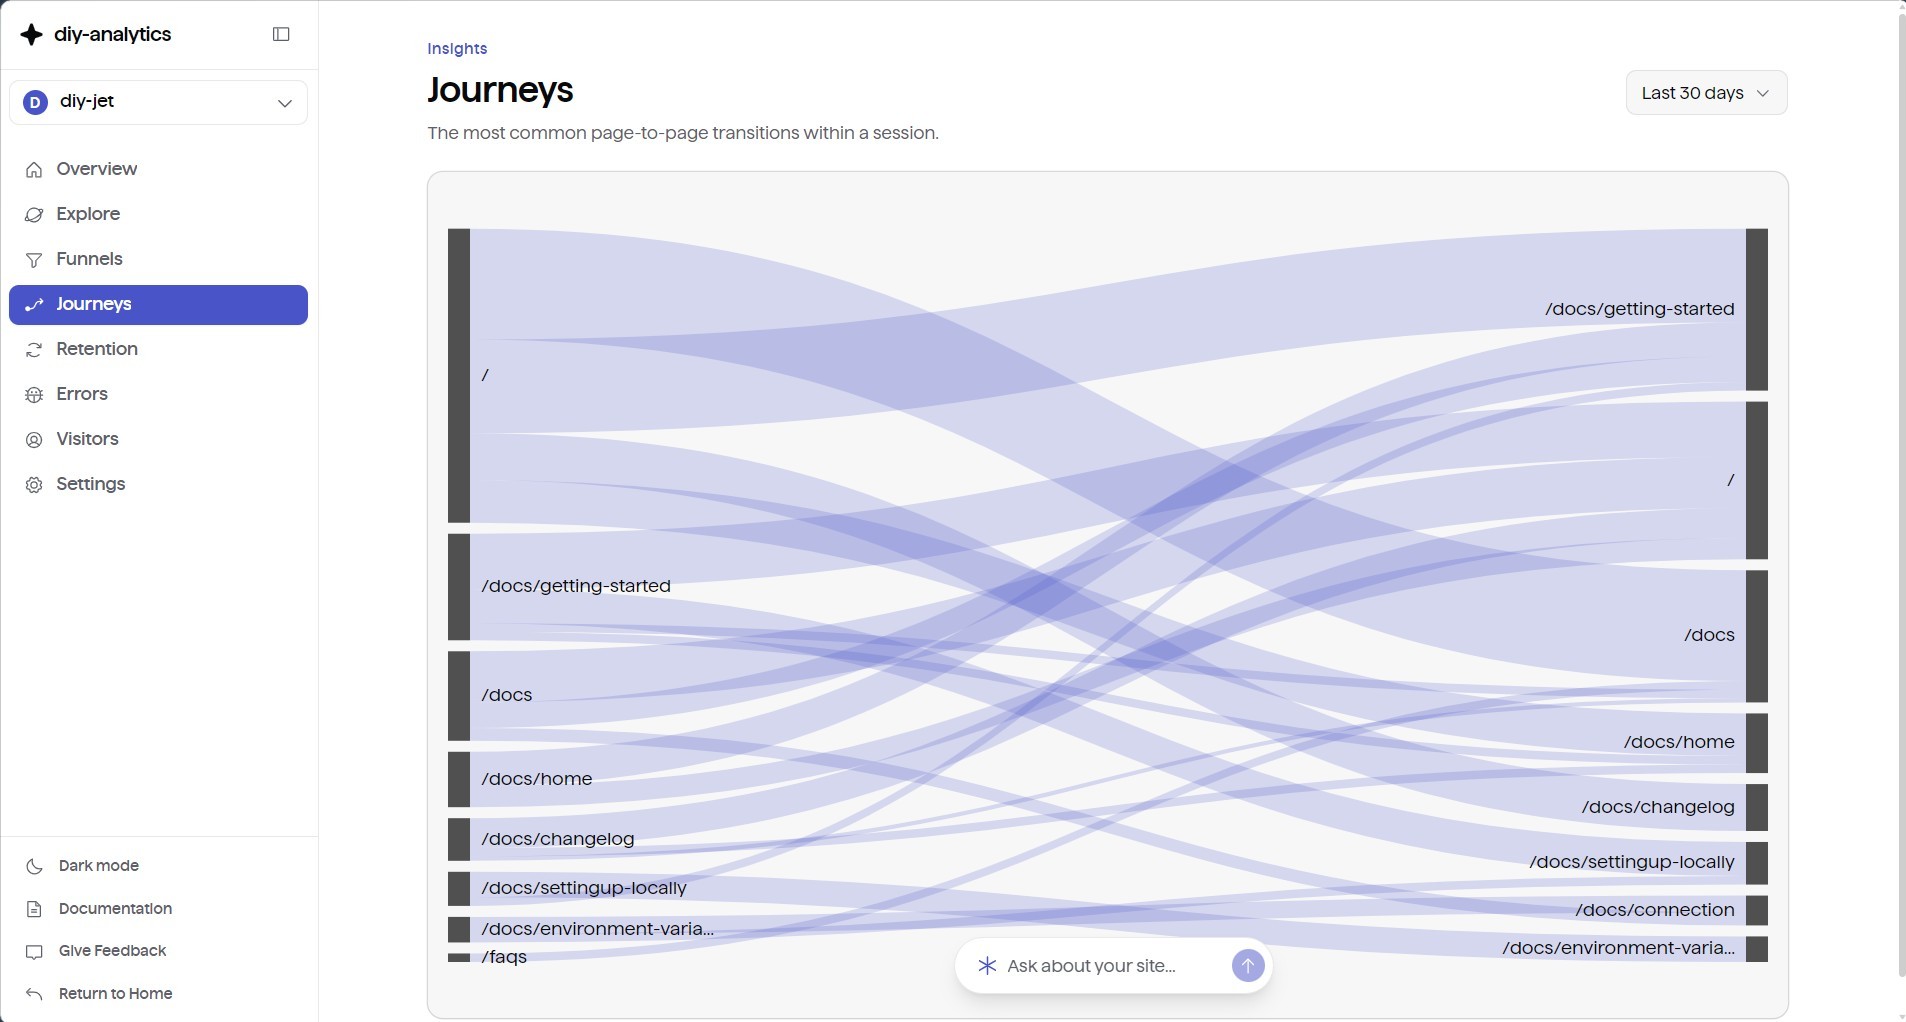
The Journeys tab shows the most common navigation sequences on your site as a Sankey flow diagram.
Key Features
- Single-Hop Transitions — direct transitions between consecutive pageviews within the same session.
- Proportional Flow Ribbons — connects the top 8 origin paths to the top 8 destination paths; ribbon thickness maps to visitor volume.
- Flexible Date Windows — analyze flows across the last 7 days, last 30 days, or last 6 months.
2. Multi-Step Conversion Funnels
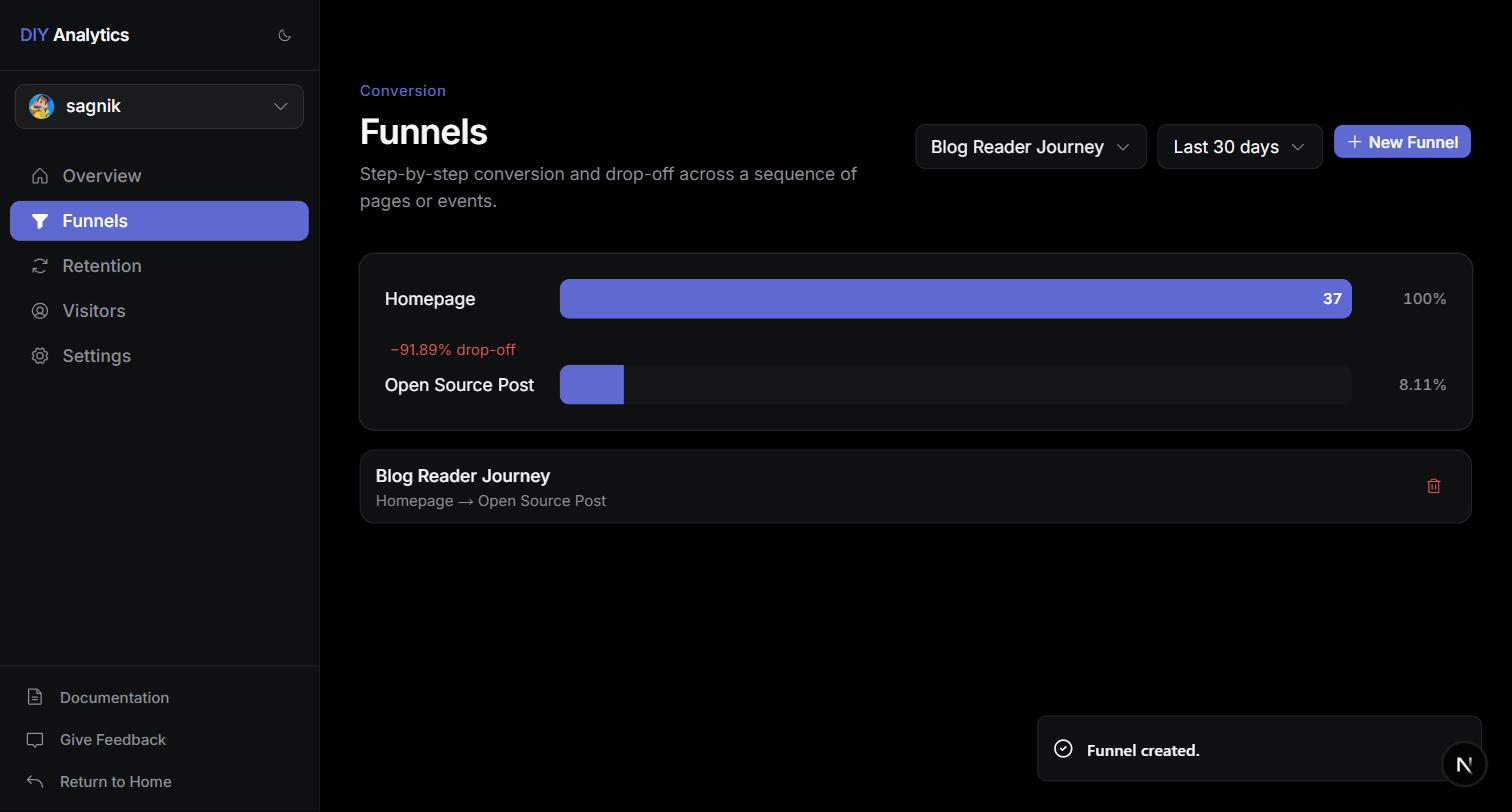
The Funnels tab lets you build ordered sequences of 2 to 10 steps to measure conversion efficiency and find friction points.
Building a Funnel
Steps combine page visits and custom event triggers:
- Step 1 (Page) —
/(Homepage) - Step 2 (Page) —
/pricing(Pricing Page) - Step 3 (Event) —
checkout_started - Step 4 (Event) —
order_completed
Funnel Analytics
- Step-by-Step Drop-Off — absolute visitor numbers and the percentage lost between consecutive stages.
- Net Conversion Rate — overall conversion from Step 1 to the final goal.
- Historical Slicing — supports all standard dashboard date presets and active filter dimensions.
3. Weekly Retention Cohorts
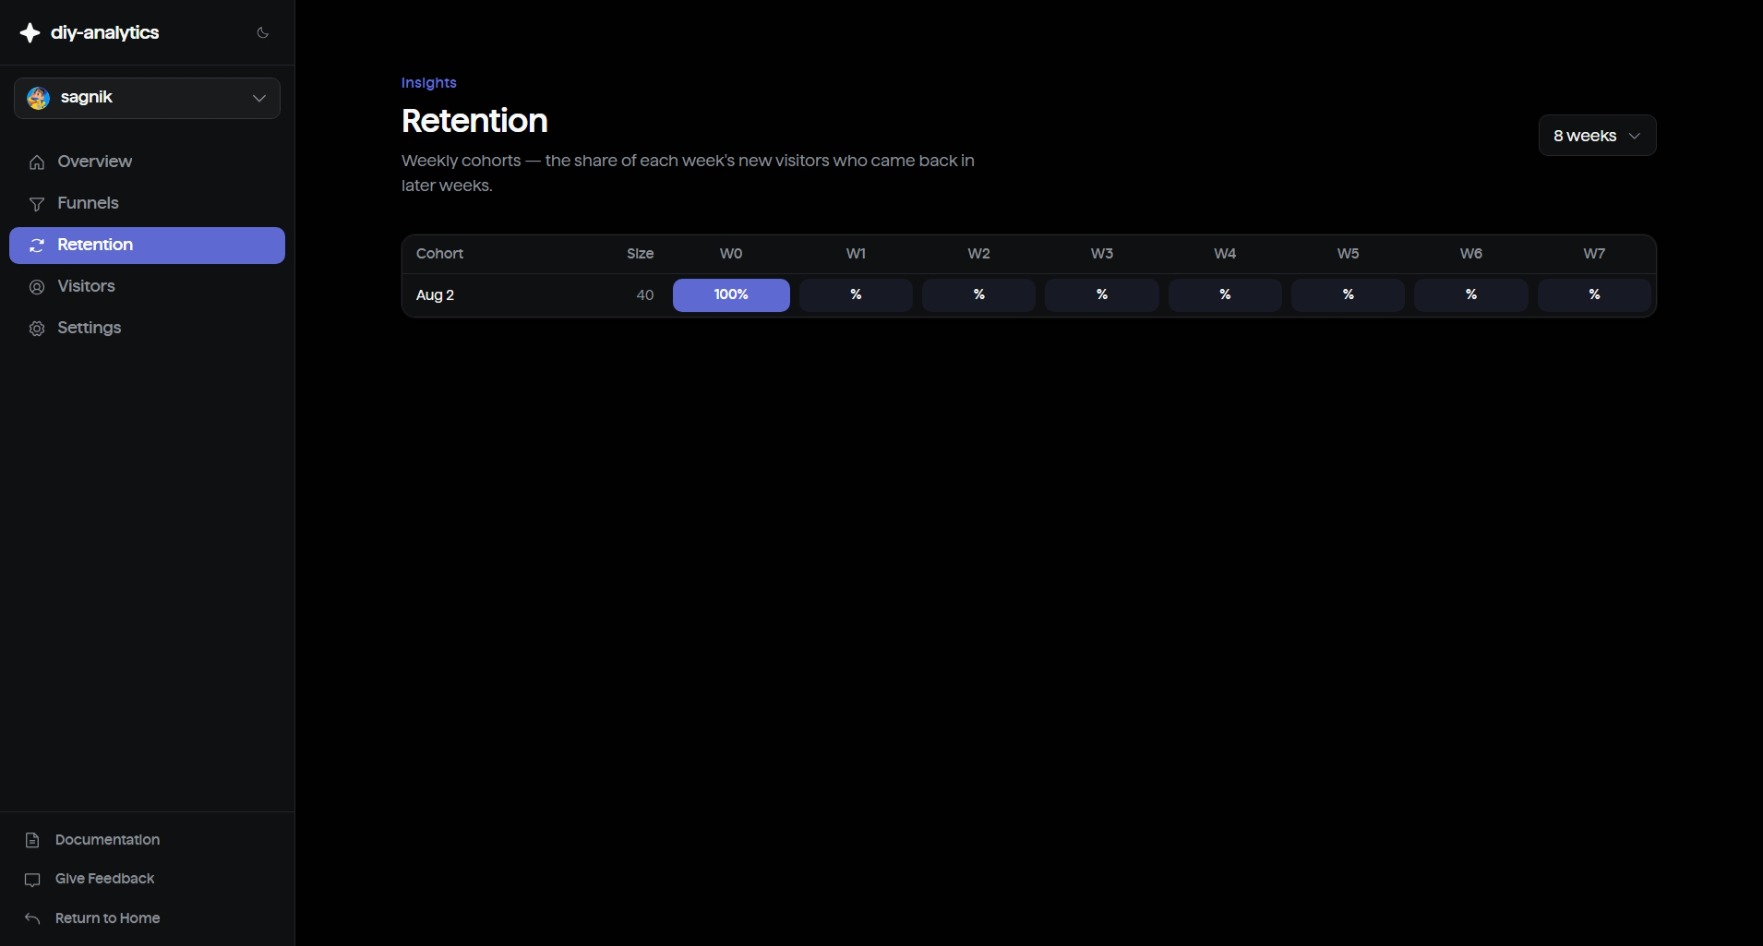
The Retention tab groups visitors into weekly cohorts by their first recorded visit, then tracks what percentage returned in subsequent weeks.
Cohort Matrices
- Configurable Windows — 4-week, 8-week, or 12-week retention grids.
- Color Heatmap — spot retention shifts across product updates and marketing campaigns at a glance.
- Longitudinal Trends — see the real decay curve of your visitor audience.
4. Visitor Directory & Automated Segments
The Visitors tab has two views.
Anonymous Visitor Directory
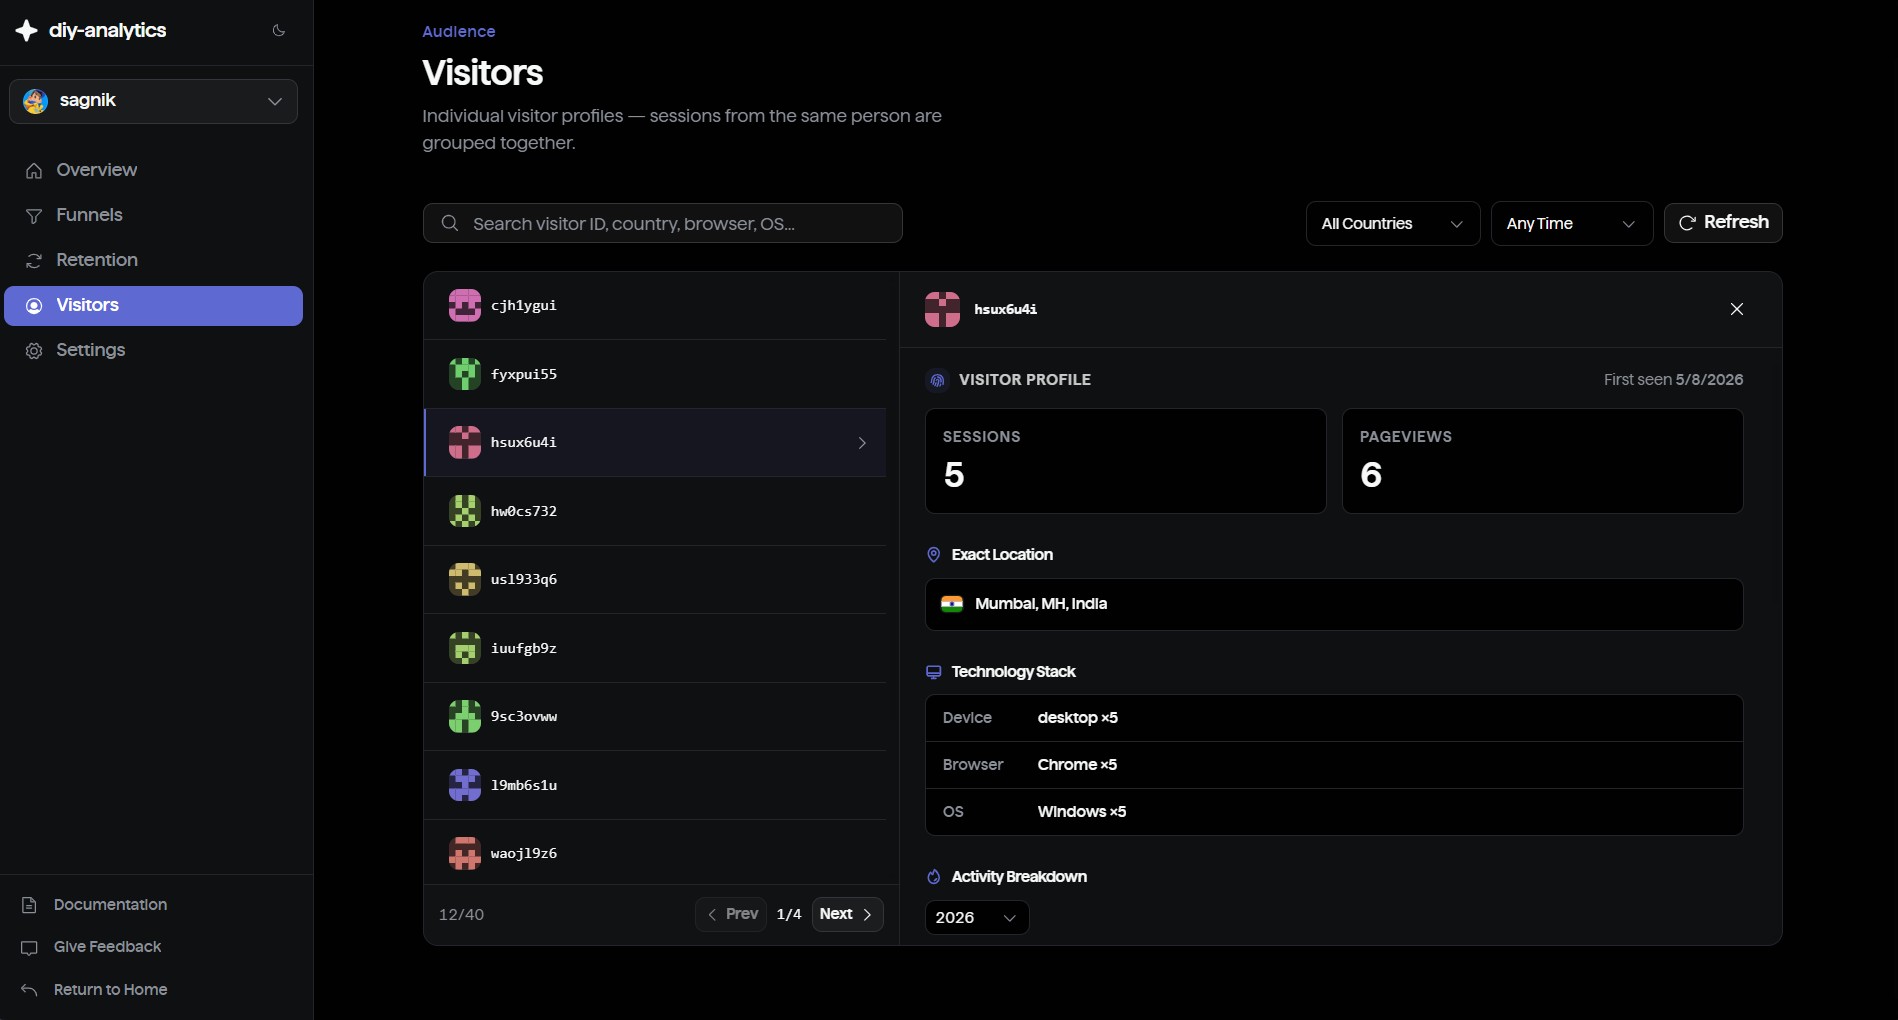
- Lists persistent anonymous visitor profiles with all sessions aggregated.
- Search and filter by country, browser, operating system, or last seen date.
- Click a visitor to open a chronological activity timeline and an annual contribution heatmap.
Automated Engagement Segments
Visitors are grouped into four behavioral segments based on median recency and frequency across your traffic:
| Segment | Behavior Profile | Typical Action |
|---|---|---|
| Active & Frequent | High visit frequency, active recently | Power users and committed customers |
| Active & Occasional | Low visit frequency, active recently | Casual visitors or new prospects |
| Lapsing | Previously frequent, inactive recently | At-risk users who may need re-engagement |
| Dormant | Low historical visits, long-term inactive | Churned visitors |
5. Explore & Ad-Hoc Query Builder
The Explore tab runs complex multi-condition queries across sessions without a predefined funnel.
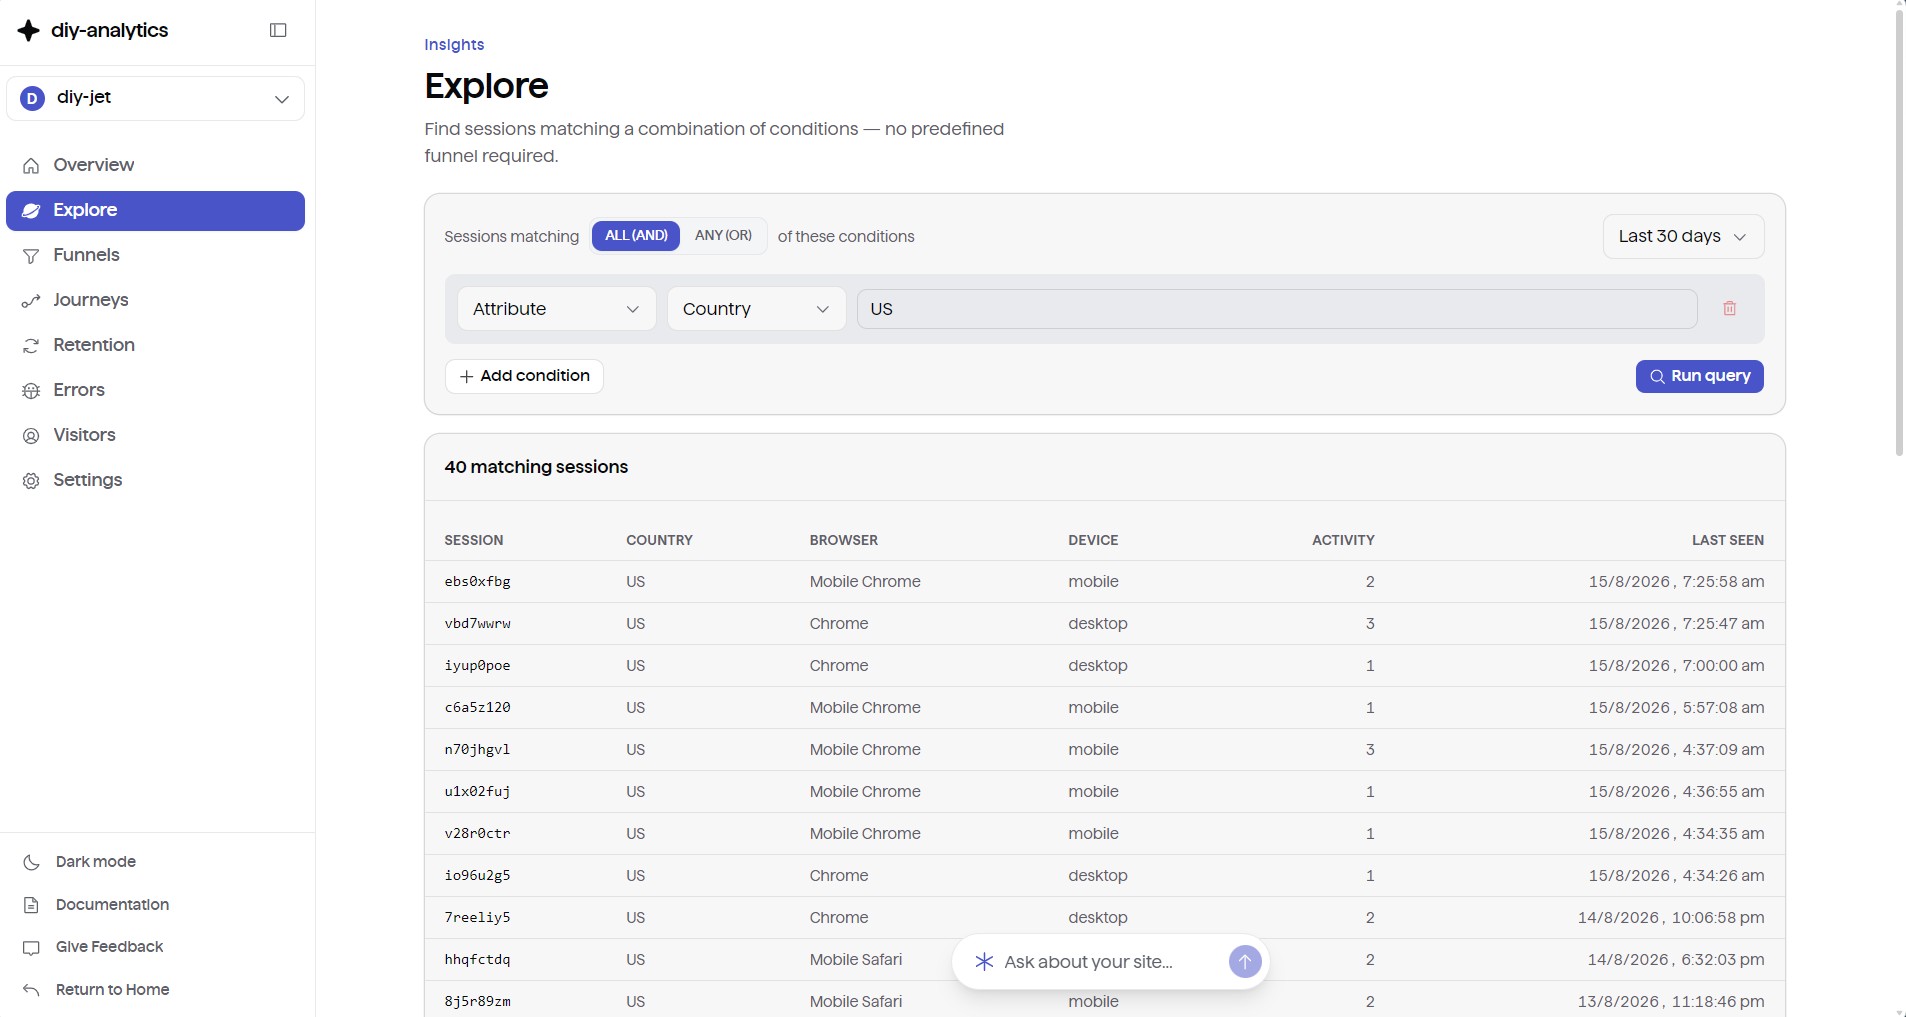
- Multi-Condition Logic — combine up to 5 conditions with global
ALL (AND)orANY (OR)logic. - Supported Dimensions — country, city, browser, OS, device, traffic source, URL path, UTM campaign, or custom event payload properties.
- Matching Sessions Table — the 50 most recent matching sessions, with activity counts and timestamps.
Explore is the fastest way to validate a hunch before you commit to building a full funnel.