Dashboard Features

A detailed reference for everything in the diy-analytics dashboard. For installing the tracking script, see Connecting Your Website; for the events API, see Custom Events & Web Vitals.

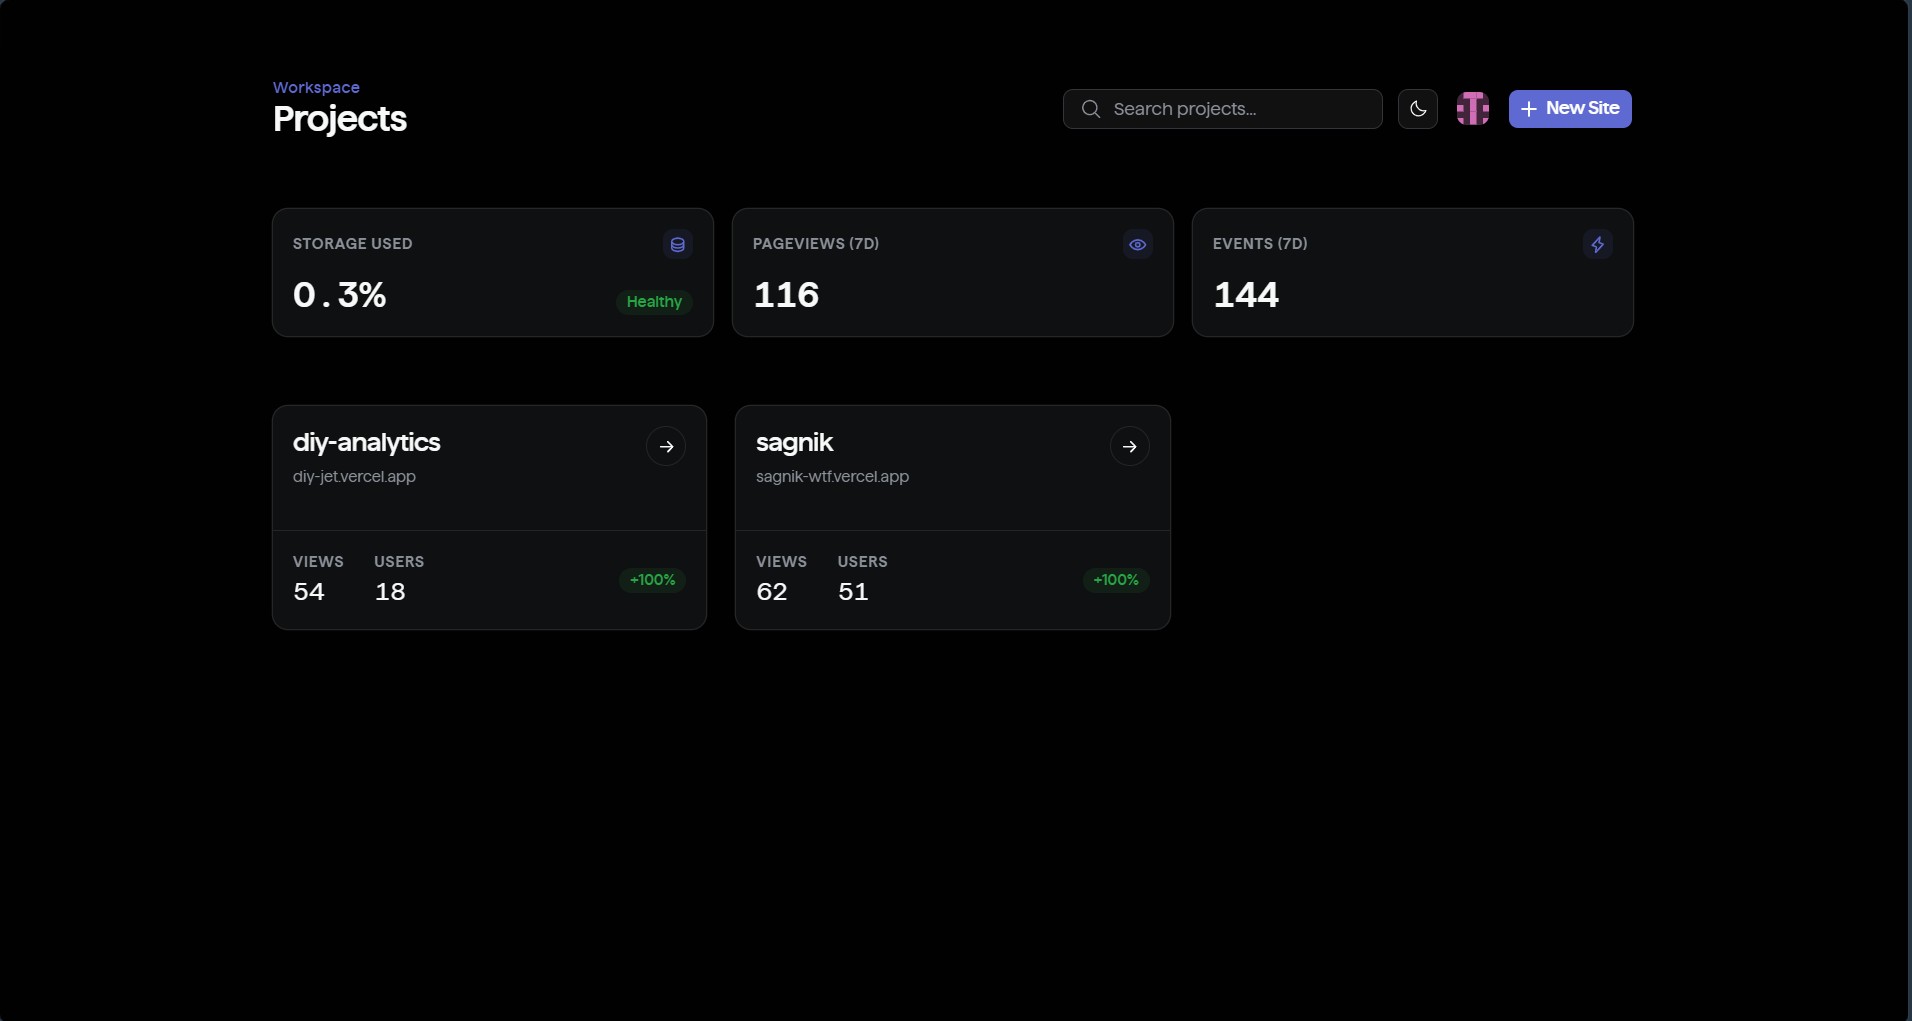
Workspace overview

Overview Dashboard

The main project page (/[workspaceSlug]/projects/[projectId]) shows:

  • Core metrics — page views, unique users, sessions, bounce rate, and average session duration, each with a percent change against the prior equivalent period.
  • A time-series chart for page views, users, and sessions, bucketed at a granularity chosen automatically from the selected range (minute, hour, day, week, or month) so the chart stays readable whether you're looking at the last hour or the last year.

Unique users are identified by a persistent anonymous ID when available, falling back to the session ID. The tracking script rotates the session ID after 20 minutes of inactivity (page visibility change, click, keypress, or scroll all count as activity).

Traffic Insights chart and Web Vitals

Date Ranges

Available presets: Last Hour, Last 24 hours, Last 7 days, Last 30 days, Last 6 months, Last 12 months, and All Time (from the project's creation date, capped at 60 months back). A custom range is also available via a start/end date picker.

Every project has a reporting timezone, set in Settings. If set, all viewers see the same time buckets regardless of their own browser timezone; if unset, each viewer sees data bucketed in their own local timezone.

Filters and Click-to-Filter

Clicking a row in most breakdown panels (a specific country, browser, page, source, etc.) scopes the entire dashboard to that value — every panel, including the core metrics chart, re-queries under the new filter. Active filters appear as removable chips above the dashboard; multiple filters combine as AND conditions. Filterable dimensions: country, browser, device, OS, city, traffic source, page path, and UTM source/medium/campaign.

Breakdown Panels

  • Top Pages — most-viewed paths, with per-page bounce rate and average time on page.
  • Entry / Exit Pages — which pages sessions most often start and end on.
  • Sources — referring domains, with Direct for traffic with no referrer.
  • Campaigns — grouped by utm_campaign.
  • UTM Breakdown — combined utm_source / utm_medium / utm_campaign view for sessions with UTM parameters.
  • Countries and Cities — geolocated from the visitor's IP at ingest time (best-effort; city/region depend on your hosting platform providing geo headers).
  • Browsers, Operating Systems, and Devices — parsed from the user agent, each with a version/model breakdown for the top values.
  • Top Events — most-fired custom events, with click-through to a per-event property drill-down.

Each panel shows a capped number of rows by default with a "View all" expansion for the full ranked list.

Countries and devices breakdown

Live Visitors

A live count of distinct sessions active in the last 5 minutes, polled every 10 seconds. Shown as a pill near the top of the dashboard; hidden entirely when the count is zero.

Custom Events

Any event sent via window.trackEvent(name, data) (see Custom Events & Web Vitals) appears in the Top Events panel. Clicking an event opens a drill-down showing:

  • The distinct property keys observed on that event's data payload (scalar values only — arrays and nested objects are excluded from breakdowns).
  • The value distribution for a selected property key, with counts and unique-user counts per value.

This lets you answer questions like "which plan values are most common on signup_completed" without predefining the property ahead of time.

Web Vitals

Largest Contentful Paint (LCP), Cumulative Layout Shift (CLS), and Interaction to Next Paint (INP) are collected automatically by the tracking script — no configuration needed. The panel shows the 75th percentile for each metric over the selected range, rated Good / Needs Improvement / Poor against the same thresholds Google uses for Core Web Vitals:

MetricGoodPoor
LCP≤ 2.5s> 4.0s
CLS≤ 0.1> 0.25
INP≤ 200ms> 500ms

Goals

Defined per project in Settings → Goals. A goal is either:

  • Page visit — converts when a session reaches a specific path.
  • Custom event — converts when a session fires a specific event name.

The dashboard's Goals panel shows conversions and conversion rate for each goal within the selected range and filters. The denominator (total sessions) counts every session with qualifying activity under the current filters — pageview or event — not just pageview sessions.

Funnels

Defined per project under the Funnels tab. A funnel is an ordered sequence of 2–10 steps, each a page-visit or custom-event match. The funnel chart shows the visitor count at each step, the drop-off percentage between consecutive steps, and the retention percentage relative to the first step. Funnels support the same date-range selection as the rest of the dashboard.

A two-step funnel with drop-off

Retention

Under the Retention tab: visitors are grouped into weekly cohorts by the week of their first-ever visit, then tracked forward to see what percentage of each cohort returned in subsequent weeks. Choose a 4, 8, or 12-week window. Empty until enough weeks of data have accumulated.

Weekly retention cohort table

Visitors

The Visitors tab lists individual anonymous visitor profiles — all sessions belonging to the same persistent ID grouped together — with filters for country, last-seen window, and free-text search across ID, country, browser, and OS. Selecting a visitor opens a detail panel with their session history and an activity heatmap.

Visitor list

Alerts

Defined per project in Settings → Alerts. An alert watches one metric (page views, unique users, or sessions) and fires a webhook notification when either:

  • Drops by (%) — the metric falls by at least a threshold percentage compared to the prior 24 hours, or
  • Falls below (raw value) — the metric drops below an absolute number.

Evaluation happens on demand via Check now in the dashboard, or by pointing an external cron job at the check endpoint.

Public Dashboards

Enabling Public Dashboard Access in a project's General settings exposes a read-only version of that project's dashboard at /public/<projectId>, with no login required. Visitors to the public dashboard can change the date range and filters, same as an authenticated user, but cannot access Settings, Goals/Alerts management, or other projects.

Workspaces and Roles

Projects belong to workspaces, and workspace membership has four roles:

RoleCan viewCan create/edit projectsCan manage membersCan delete workspace
ViewerYesNoNoNo
MemberYesYesNoNo
AdminYesYesYesNo
OwnerYesYesYesYes

The Profile page lists every workspace you belong to and your role in each, with a switcher to jump between them.

Project Settings

  • General — project name, project ID, reporting timezone, and the public-dashboard toggle with its shareable link.
  • Tracking & Privacy — exclude your own IP from analytics, exclude URL path patterns (supports a trailing * wildcard) from ever being recorded, and the copyable tracking snippet.
  • Goals — create/delete conversion goals.
  • Alerts — create/delete alerts and trigger an on-demand check.
  • Data — export an aggregate CSV snapshot.
  • Danger Zone — permanently delete the project and all its analytics data. Requires typing a confirmation phrase and a short safety delay.

Project Settings — General tab

Data Export

Settings → Data → Download CSV exports an all-time aggregate snapshot as a single CSV file, sectioned by pages, entry pages, exit pages, sources, campaigns, countries, browsers, devices, goals, and top events. This is an aggregate report generated on demand — it does not include raw per-visitor session data.